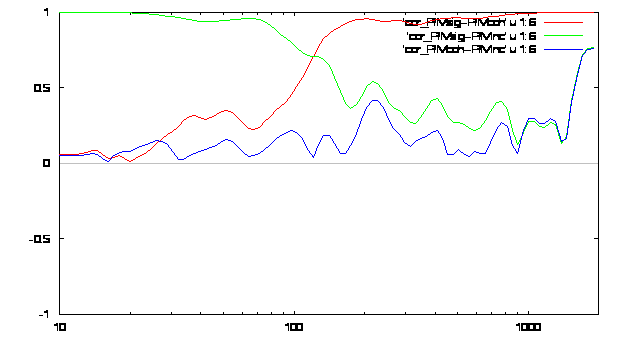
A short illustration what the “coherent-incoherent” filtering looks like in terms of “wavelet cross-correlation”.
We consider an noisy example of geomagnetic field registration – the data from PIM station and apply the decomposition in Coherent and Incoherent parts. Then we calculate the wavelet cross-correlation for each couple: original data – coherent part (red), original data – incoherent part (green), coherent part – incoherent part (blue).

In the figure we show the modulus of wavelet cross-correlation function versus the time scale, given in minutes (from 10 to 2000 minutes). This illustration clearly support the idea of “coherent-incoherent” filtering, showing explicitly the band of filtering. One can see that the coherent part and the original signal are strongly correlated for a>200 minutes as well as the incoherent part is correlated with the original signal for a<70 minutes. In the band 70<a<200 the original signal is divided in some way between the two parts.