Basic Machine Learning - Decision Trees
Decision Trees
Decision trees create partitions on the data. Let's start with the well-known Iris dataset.
library(datasets)
str(iris)
## 'data.frame':	150 obs. of  5 variables:
##  $ Sepal.Length: num  5.1 4.9 4.7 4.6 5 5.4 4.6 5 4.4 4.9 ...
##  $ Sepal.Width : num  3.5 3 3.2 3.1 3.6 3.9 3.4 3.4 2.9 3.1 ...
##  $ Petal.Length: num  1.4 1.4 1.3 1.5 1.4 1.7 1.4 1.5 1.4 1.5 ...
##  $ Petal.Width : num  0.2 0.2 0.2 0.2 0.2 0.4 0.3 0.2 0.2 0.1 ...
##  $ Species     : Factor w/ 3 levels "setosa","versicolor",..: 1 1 1 1 1 1 1 1 1 1 ...
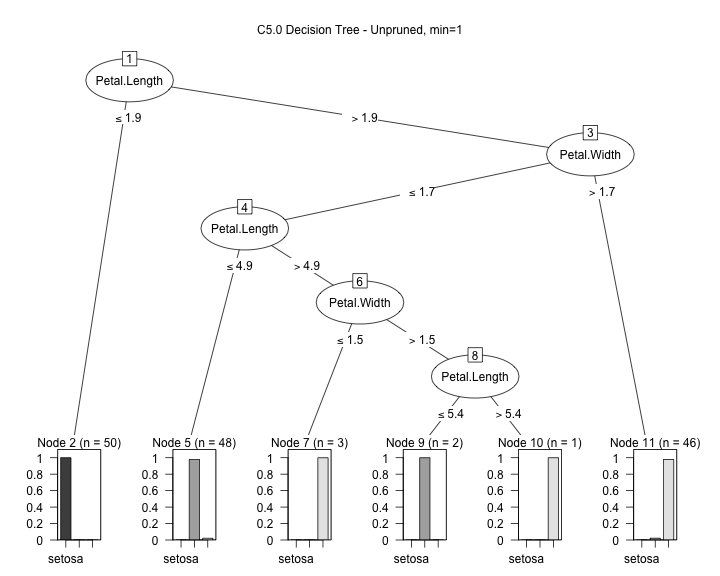
Let's create a C5.0 decision tree that predicts the species from the petal and sepal width and length.
library(C50)
input <- iris[,1:4]
output <- iris[,5]
model1 <- C5.0(input, output, control = C5.0Control(noGlobalPruning = TRUE,minCases=1))
plot(model1, main="C5.0 Decision Tree - Unpruned, min=1")

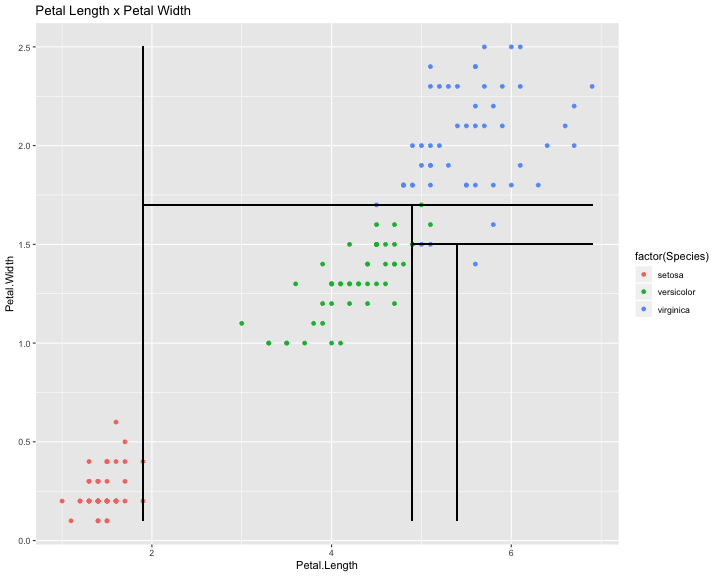
We can see (with some work...) the boundaries caused by the branches of the tree:
library(ggplot2)
ggplot(iris,aes(x=Petal.Length,y=Petal.Width))+
  geom_point(aes(colour = factor(Species)))+
  # Petal.Length = 1.9
  geom_segment(aes(x=1.9,y=min(iris$Petal.Width),xend=1.9,yend=max(iris$Petal.Width)))+
  # Petal.Width = 1.7
  geom_segment(aes(x=1.9,y=1.7,xend=max(iris$Petal.Length),yend=1.7))+
  # Petal.Length = 4.9
  geom_segment(aes(x=4.9,y=1.7,xend=4.9,yend=min(iris$Petal.Width)))+
  # Petal.Width = 1.5
  geom_segment(aes(x=4.9,y=1.5,xend=max(iris$Petal.Length),yend=1.5))+
  # Petal.Length = 5.4
  geom_segment(aes(x=5.4,y=1.5,xend=5.4,yend=min(iris$Petal.Width)))+
  ggtitle("Petal Length x Petal Width")

We can get interesting information from the model:
summary(model1)
##
## Call:
## C5.0.default(x = input, y = output, control =
##  C5.0Control(noGlobalPruning = TRUE, minCases = 1))
##
##
## C5.0 [Release 2.07 GPL Edition]  	Thu Aug 29 12:48:33 2019
## -------------------------------
##
## Class specified by attribute `outcome'
##
## Read 150 cases (5 attributes) from undefined.data
##
## Decision tree:
##
## Petal.Length <= 1.9: setosa (50)
## Petal.Length > 1.9:
## :...Petal.Width > 1.7: virginica (46/1)
##     Petal.Width <= 1.7:
##     :...Petal.Length <= 4.9: versicolor (48/1)
##         Petal.Length > 4.9:
##         :...Petal.Width <= 1.5: virginica (3)
##             Petal.Width > 1.5:
##             :...Petal.Length <= 5.4: versicolor (2)
##                 Petal.Length > 5.4: virginica (1)
##
##
## Evaluation on training data (150 cases):
##
## 	    Decision Tree
## 	  ----------------
## 	  Size      Errors
##
## 	     6    2( 1.3%)   <<
##
##
## 	   (a)   (b)   (c)    <-classified as
## 	  ----  ----  ----
## 	    50                (a): class setosa
## 	          49     1    (b): class versicolor
## 	           1    49    (c): class virginica
##
##
## 	Attribute usage:
##
## 	100.00%	Petal.Length
## 	 66.67%	Petal.Width
##
##
## Time: 0.0 secs
C5imp(model1,metric='usage')
##              Overall
## Petal.Length  100.00
## Petal.Width    66.67
## Sepal.Length    0.00
## Sepal.Width     0.00
Can we predict the class from the numerical attributes?
newcases <- iris[c(1:3,51:53,101:103),]
newcases
##     Sepal.Length Sepal.Width Petal.Length Petal.Width    Species
## 1            5.1         3.5          1.4         0.2     setosa
## 2            4.9         3.0          1.4         0.2     setosa
## 3            4.7         3.2          1.3         0.2     setosa
## 51           7.0         3.2          4.7         1.4 versicolor
## 52           6.4         3.2          4.5         1.5 versicolor
## 53           6.9         3.1          4.9         1.5 versicolor
## 101          6.3         3.3          6.0         2.5  virginica
## 102          5.8         2.7          5.1         1.9  virginica
## 103          7.1         3.0          5.9         2.1  virginica
predicted <- predict(model1, newcases, type="class")
predicted
## [1] setosa     setosa     setosa     versicolor versicolor versicolor
## [7] virginica  virginica  virginica
## Levels: setosa versicolor virginica
Variations on the model
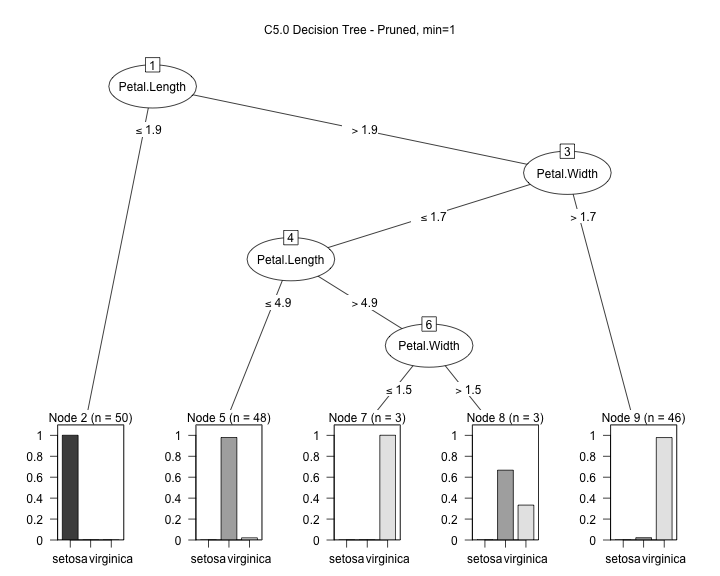
A more compact tree (with more errors)
model2 <- C5.0(input, output, control = C5.0Control(noGlobalPruning = FALSE,minCases=1))
plot(model2, main="C5.0 Decision Tree - Pruned, min=1")

model2
##
## Call:
## C5.0.default(x = input, y = output, control =
##  C5.0Control(noGlobalPruning = FALSE, minCases = 1))
##
## Classification Tree
## Number of samples: 150
## Number of predictors: 4
##
## Tree size: 5
##
## Non-standard options: attempt to group attributes, minimum number
##  of cases: 1
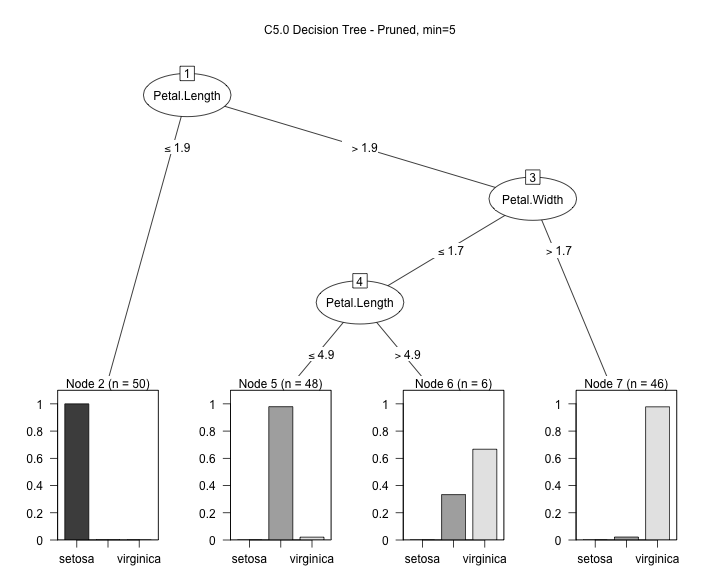
An even more compact tree (with even more errors)
model3 <- C5.0(input, output, control = C5.0Control(noGlobalPruning = FALSE,minCases=5))
plot(model3, main="C5.0 Decision Tree - Pruned, min=5")

Warning: Code and results presented on this document are for reference use only. Code was written to be clear, not efficient. There are several ways to achieve the results, not all were considered.
See the R source code for this notebook.