Fun with Meteorological Data (PCDs)
About
The Brazilian National Institute for Space Research (Instituto Nacional de Pesquisas Espaciais, INPE), through its Center for Weather Forecasting and Climate Research (Centro de Previsão de Tempo e Estudos Climáticos, CPTEC), collects several different weather variables using a network of data collecting platforms (Plataformas de Coleta de Dados, PCDs). This data can be accessed in different ways. In this example we will use a database dump of part of the data to answer some questions about weather.
The Data
The data avaliable for this example consists of several text files, with filenames like PCD_20080101_20081231.dat. Each file contains data on a time interval, stated in the file's name. A sample of the contents of the files is shown below.
#      est      lon      lat      alt       ur       tx       tn        r      data
     31000 -45.0020 -22.6750   563.00      999    37.50  9999.99  9999.99  20030101
     31754 -37.6330  -7.7540   553.00      999  9999.99  9999.99     0.00  20030101
     31935 -38.9760  -8.7550   318.00      999  9999.99  9999.99     0.00  20030101
     32003 -44.2070  -2.5900    62.00       38    33.50  9999.99  9999.99  20030101
We have 23 files with data. Each file contains between 3600 and 145000 lines. The first line describes the variables, and each line contains the daily measures for several variables for a specific data collection platform (PCD) and date. Data is separated by spaces.
Here is the list of variables
- est: The number (id) of the data collecting platform.
- lon: The longitude where this platform is located.
- lat: The latitude where this platform is located.
- alt: The altitude where this platform is located.
- ur: The relative humidity measured on that date by that platform.
- tx: The maximum temperature measured on that date by that platform.
- tn: The minimum temperature measured on that date by that platform.
- r: The rainfall measured on that date by that platform.
- data: The date corresponding to this measure.
Data is not really tidy: some variables are redundant, some values are missing, and missing data is represented by either 999 or 9999.99. For this data, missing values are associated with data quality -- the records used to calculate that measure for that station and day were not considered reliable enough.
For our Data Science exercise we will:
- Read and organize the data in a Tidy data frame
- Get some basic statistics on the data
- Visualize the data
- Further cleaning of the data
Reading and organizing the data in a tidy data frame
Reading the file
To read one of the data files into a R data frame we could run:
file = "Data/PCDs/PCD_20060101_20061231.dat"
# Let's read the file, using spaces as separators, with the first line as the header,
# read only 10 rows, missing strings will be represented as NAs,
# strings will not be factorized.
data <- read.table(file, sep = "",
                    header = TRUE, nrows = 10,
                    na.strings ="NA", stringsAsFactors = FALSE)
The problem is that the first row contains the character "#" that indicates it is a comment. Using the above command we will skip the first line and the following line will set the columns headers:
str(data)
## 'data.frame':	10 obs. of  9 variables:
##  $ X31000   : int  31816 31817 31818 31819 31823 31830 31831 31832 31833 31834
##  $ X.45.0020: num  -40 -39.2 -37.9 -38.8 -41.1 ...
##  $ X.22.6750: num  -2.87 -6.09 -4.56 -4.43 -2.92 ...
##  $ X563.00  : num  13 317 6 107 94 11 110 180 5 153
##  $ X999     : int  75 37 45 42 58 46 42 46 59 29
##  $ X29.00   : num  10000 10000 10000 10000 10000 ...
##  $ X17.00   : num  10000 10000 10000 10000 10000 ...
##  $ X9999.99 : num  10000 10000 10000 10000 10000 ...
##  $ X20060101: int  20060101 20060101 20060101 20060101 20060101 20060101 20060101 20060101 20060101 20060101
Fixing the header
Not good. Let's see a solution from Stack Overflow: R- my first row has # character in the column names?:
# Let's read one line of the file, expecting it to contain strings,
# without messages to the console.
scannedNames <- scan(text = readLines(file, 1),
                     what="",quiet = TRUE)
# Let's remove the first element of the resulting vector.
scannedNames <- scannedNames[-1]
scannedNames
## [1] "est" "lon" "lat" "alt" "ur" "tx" "tn" "r" "data"
Looks OK! Let's read the file again, without considering the first line as header and using those column names.
# Let's read the file, using spaces as separators, ignoring the header,
# missing strings will be represented as NAs, strings will not be factorized.
data <- read.table(file, sep = "", header = FALSE,
                   na.strings ="NA", stringsAsFactors = FALSE, col.names = scannedNames)
Actually we went through all that work to read the column names, but some of them aren't very clear or descriptive. We can change the columns names with the following code:
colnames(data) <- c("station","longitude","latitude","altitude","relhumidity",
                    "maxtemp","mintemp","rainfall","date")
Now the columns' names and descriptions are:
- station: The number (id) of the data collecting platform.
- longitude: The longitude where this platform is located.
- latitude: The latitude where this platform is located.
- altitude: The altitude where this platform is located.
- relhumidity: The relative humidity measured on that date by that platform.
- maxtemp: The maximum temperature measured on that date by that platform.
- mintemp: The minimum temperature measured on that date by that platform.
- rainfall: The rainfall measured on that date by that platform.
- date: The date corresponding to this measure.
How does it looks like now?
str(data)
## 'data.frame':	146403 obs. of  9 variables:
##  $ station    : int  31000 31816 31817 31818 31819 31823 31830 31831 31832 31833 ...
##  $ longitude  : num  -45 -40 -39.2 -37.9 -38.8 ...
##  $ latitude   : num  -22.68 -2.87 -6.09 -4.56 -4.43 ...
##  $ altitude   : num  563 13 317 6 107 94 11 110 180 5 ...
##  $ relhumidity: int  999 75 37 45 42 58 46 42 46 59 ...
##  $ maxtemp    : num  29 10000 10000 10000 10000 ...
##  $ mintemp    : num  17 10000 10000 10000 10000 ...
##  $ rainfall   : num  10000 10000 10000 10000 10000 ...
##  $ date       : int  20060101 20060101 20060101 20060101 20060101 20060101 20060101 20060101 20060101 20060101 ...
Much better! But it seems that str is lying to us, why are all those 10000s on its output? Let's verify.
# Get the header of a subset of the data frame containing only
# station, maxtemp, mintemp, rainfall, date.
head(subset(data, select = c(station,maxtemp,mintemp,rainfall,date)))
##   station maxtemp mintemp rainfall     date
## 1   31000   29.00   17.00  9999.99 20060101
## 2   31816 9999.99 9999.99  9999.99 20060101
## 3   31817 9999.99 9999.99  9999.99 20060101
## 4   31818 9999.99 9999.99  9999.99 20060101
## 5   31819 9999.99 9999.99  9999.99 20060101
## 6   31823 9999.99 9999.99  9999.99 20060101
OK, values are the expected ones, str just rounded them to print.
Cleaning some Columns
Some of the columns on the data appear to be redundant. If each PCD is in a fixed location, why not remove its coordinates?
# Select all columns but longitude,latitude,altitude
data <- subset(data,select=-c(longitude,latitude,altitude))
str(data)
## 'data.frame':	146403 obs. of  6 variables:
##  $ station    : int  31000 31816 31817 31818 31819 31823 31830 31831 31832 31833 ...
##  $ relhumidity: int  999 75 37 45 42 58 46 42 46 59 ...
##  $ maxtemp    : num  29 10000 10000 10000 10000 ...
##  $ mintemp    : num  17 10000 10000 10000 10000 ...
##  $ rainfall   : num  10000 10000 10000 10000 10000 ...
##  $ date       : int  20060101 20060101 20060101 20060101 20060101 20060101 20060101 20060101 20060101 20060101 ...
str(data) tells us that values in the column date are integers -- we expect it to be a proper date, just for tidyness (and to allow date range manipulation if need arises). Since date is an integer we need to convert it to characters then to dates.
# Get the date column as a character, convert it to date using the format YYYYMMDD.
data$date <- as.Date(as.character(data$date), "%Y%m%d")
Now we have some 999s (and similar values) that were used to denote missing values on some columns on our data set. Let's change those to NAs.
# Replace all 999s in column relhumidity
data$relhumidity[data$relhumidity == 999] <- NA
# Replace all 9999.99s in column maxtemp
data$maxtemp[data$maxtemp == 9999.99] <- NA
# Replace all 9999.99s in column mintemp
data$mintemp[data$mintemp == 9999.99] <- NA
# Replace all 9999.99s in column rainfall
data$rainfall[data$rainfall == 9999.99] <- NA
str(data)
## 'data.frame':	146403 obs. of  6 variables:
##  $ station    : int  31000 31816 31817 31818 31819 31823 31830 31831 31832 31833 ...
##  $ relhumidity: int  NA 75 37 45 42 58 46 42 46 59 ...
##  $ maxtemp    : num  29 NA NA NA NA NA NA NA NA NA ...
##  $ mintemp    : num  17 NA NA NA NA NA NA NA NA NA ...
##  $ rainfall   : num  NA NA NA NA NA NA NA NA NA NA ...
##  $ date       : Date, format: "2006-01-01" "2006-01-01" ...
Getting some basic statistics on the data
With the data frame ready (even with lots of NAs on it), we can ask some basic questions on the data. First, which are the maximum and minimum temperatures on the dataset?
# Get the minimum and maximum value of the respective fields, disregarding NAs.
min(data$mintemp,na.rm = TRUE)
## [1] -5
max(data$maxtemp,na.rm = TRUE)
## [1] 45
Let's list the whole rows where these conditions occur:
# Get the rows where the mintemp is the minimum.
# This does not work: data[data$mintemp==-5,] because it will also consider
# NA values
# https://stackoverflow.com/questions/1686569/filter-data-frame-rows-by-a-logical-condition
subset(data, mintemp==min(data$mintemp,na.rm = TRUE))
##        station relhumidity maxtemp mintemp rainfall       date
## 130252   31921          46    35.5      -5       NA 2006-11-23
## 131988   31925          96    30.0      -5       NA 2006-11-27
# Do the same for maxtemp.
subset(data, maxtemp==max(data$maxtemp,na.rm = TRUE))
##       station relhumidity maxtemp mintemp rainfall       date
## 38247   32595          NA      45       9       28 2006-04-02
We can always create new colums from existing ones! Let's add a temperature range column.
# Create new deltatemp column by an operation on the mintemp and maxtemp.
data$deltatemp = data$maxtemp-data$mintemp
Let's get the places with the largest difference in temperature:
subset(data, deltatemp==max(data$deltatemp,na.rm = TRUE))
##        station relhumidity maxtemp mintemp rainfall       date deltatemp
## 132884   31928          48    40.5    -2.5       NA 2006-11-29        43
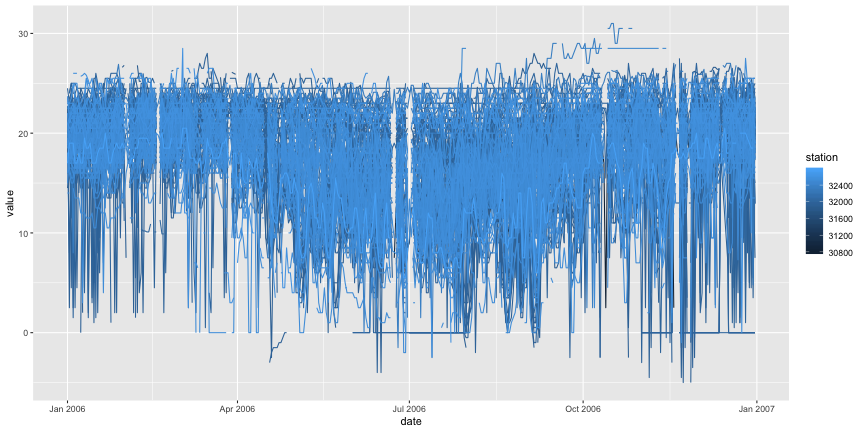
Let's visualize some data. Let's start with the time series of the minimum temperatures:
# Select only the variables relevant to the plot: date (x axis), mintemp (y axis)
# and station (grouping)
subset <- subset(data,select=c(date,station,mintemp))
# ggplot2 requires the data frame to be reshaped, using data and station as ids.
# https://stackoverflow.com/questions/13324004/plotting-multiple-time-series-in-ggplot
library(reshape2)
melted <- melt(subset,id=c("date","station"))
# Now we can plot the multiple time series.
library(ggplot2)
ggplot(melted,aes(x=date,y=value,colour=station,group=station)) + geom_line()
## Warning: Removed 85795 rows containing missing values (geom_path).

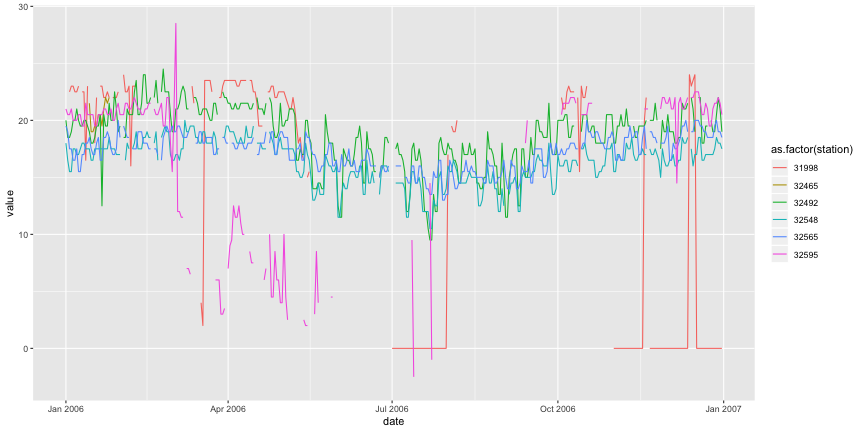
Just to be sure, let's do the same thing with only six PCDs:
subset2 <- subset[subset$station %in% c("32492","32565","32548","32595","32465","31998"), ]
melted <- melt(subset2,id=c("date","station"))
# Plot the three time series.
ggplot(melted,aes(x=date,y=value,colour=as.factor(station),group=station)) + geom_line()
## Warning: Removed 3 rows containing missing values (geom_path).

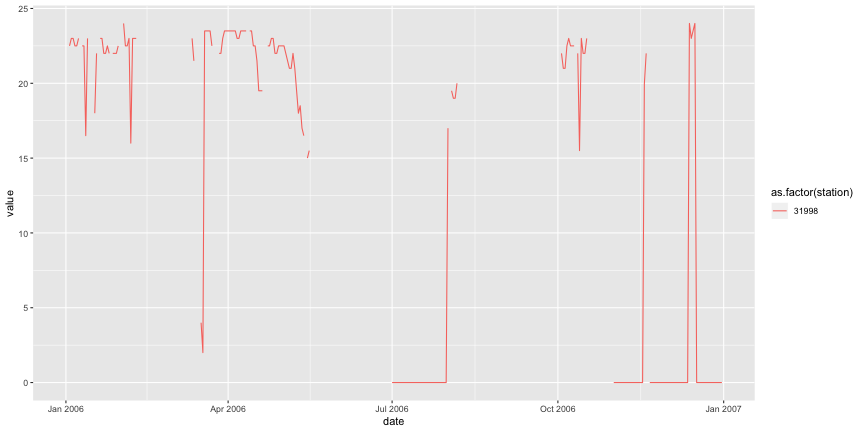
Something is really strange with this data... Let's check only one PCD.
subset3 <- subset[subset$station %in% c("31998"), ]
melted <- melt(subset3,id=c("date","station"))
# Plot the three time series.
ggplot(melted,aes(x=date,y=value,colour=as.factor(station),group=station)) + geom_line()

We have lots of gaps caused by missing data, which is acceptable -- stations could be broken, data was considered unreliable, etc. We also have lots of "jumps" on the temperature in short intervals, e.g. more than 5 degrees of difference between days, which may be possible. But we have some long intervals with the minimum temperature being exactly 0 degrees, which may suggest that the data was labeled as OK but incorrectly measured.
Final remarks
Considering the gaps and strange values on the data, that this dataset would be used to answer basic (historic) weather questions, we decided to stop processing and analyzing it.
Warning: Code and results presented on this document are for reference use only. Code was written to be clear, not efficient. There are several ways to achieve the results, not all were considered.
See the R source code for this notebook.